The System Usage Tab in the Admin Hub displays various KPIs depicting the current Pyramid usage for queries, content, and hourly usage. You can customize your own view of the System Usage using the hub tool; your edits will not be visible to other users.
The Hub usage panel is complemented by a more comprehensive built-in dashboard which shows many more metrics and analyses. Importantly it also includes analysis of UNUSED content, UNUSED data sources and users who have NOT logged in.
Hub Usage Panels
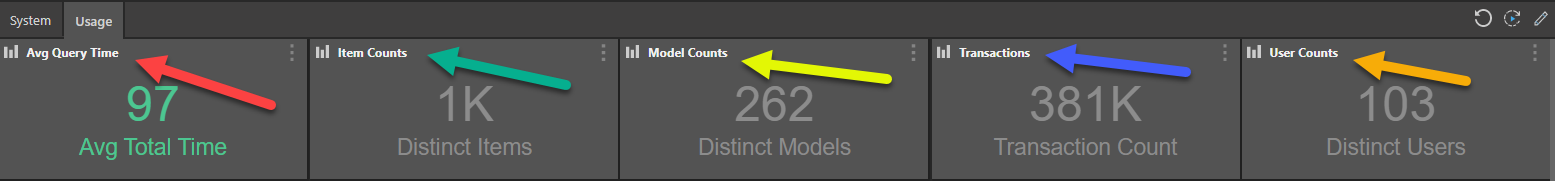
KPI Panel
- Avg Total Time (red arrow) displays the average time for all queries processed today.
- Distinct Items: (green arrow) displays the number of distinct items in the repository.
- Model Counts: (yellow arrow) displays the number of distinct models in the repository.
- Transactions: (blue arrow) displays the count of transactions processed.
- Distinct Users:(orange arrow) displays the distinct count of users accessing the system.
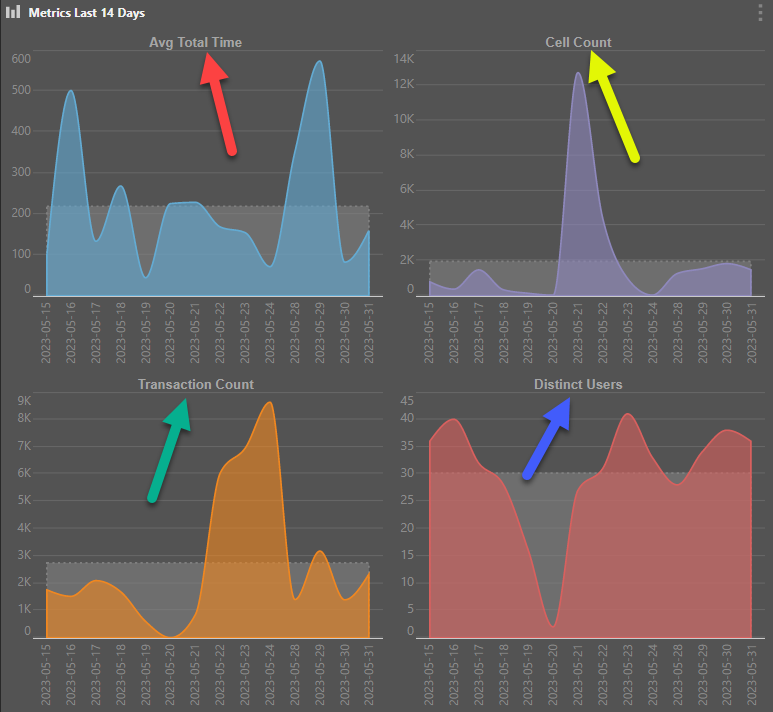
Metrics Last 14 Days
- Avg Total Time (red arrow) displays the average total time for all queries processed in the last 14 days. The gray line depicts the average count.
- Cell count: (yellow arrow) displays the number of cells accessed in queries in the last 14 days. The gray line depicts the average count.
- Transaction Count: (green arrow) displays the number of transactions processed in the last 14 days. The gray line depicts the average count.
- Distinct Users: (blue arrow) displays the count of distinct users accessing the system in the last 14 days. The gray line depicts the average count.
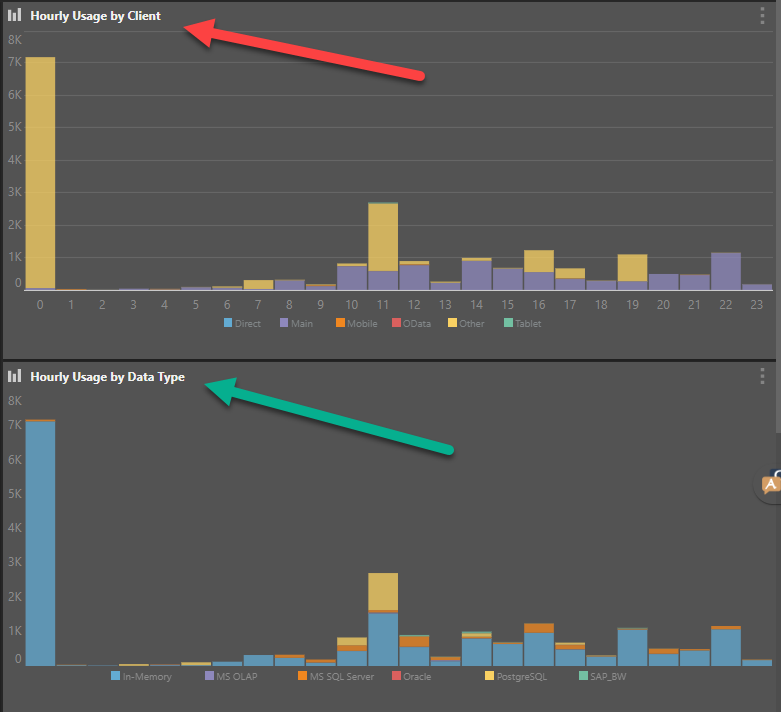
Hourly Usage
- Hourly Usage by Client (red arrow) displays the transaction count hourly usage by client type (direct, main, mobile, OData, other, and tablet).
- Hourly Usage by Data Type: (green arrow) displays the transaction count hourly usage by configured data source types (in-memory, MS OLAP, MS SQL Server, Oracle, Postgres, SAP-BW, etc)
Standalone Usage Dashboard
The system usage tab in the admin hub (described below) is supplemented by a standalone Usage Dashboard fund in the public \ _usage folder . The dashboard includes many of the same charts and KPIs as well as numerous other visualizations and analyses. The dashboard covers both USAGE and NON-USAGE of the system across these dimensions:
- Users
- Catalog content (reports, dashboard, publications)
- Data Sources (servers, databases and data models)
- Semantic Elements (attributes and measures)
- Processing services
- Modules (Discover, Present, Pubish etc)
- Devices
- Venues (Client, mobile, Embed, APIs etc)